Introduction
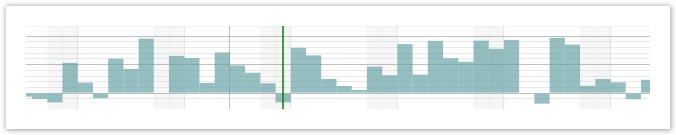
Using the ChartLayout class results in activities being laid out as chart bars. A series of such bars can for example be used to form a capacity profile. Activities of type ChartActivity will be placed on a zeroline between the minimum and the maximum value of the layout. The height of the chart activity will be based on the value returned by ChartActivity.getChartValue(). Activities of type HighLowChartActivity will appear as floating bars. The layout also supports the definition of minor and major chart lines drawn in the row background.
Min & Max Value
The chart layout provides two properties that control the actual layout of the chart activities: minValue and maxValue. These values have to be managed by the application, not the framework. They can be set by calling ChartLayout.setMinValue() or ChartLayout.setMaxValue().
Major & Minor Ticks
A list of major and minor ticks is available on each chart layout instance. Values can be added to these lists in order to render value lines in the background of the row. Example: the min value is equal to 0 the max value is equal to 100. Then it would make sense to define major ticks for the values 50 and 100. Minor ticks might be at 10, 20, 30, 40, 60, 70, 80 and 90.