Klasse GanttChartLite<R extends Row<?,?,?>>
java.lang.Object
javafx.scene.Node
javafx.scene.Parent
javafx.scene.layout.Region
javafx.scene.control.Control
com.flexganttfx.view.util.FlexGanttFXControl
com.flexganttfx.view.GanttChartBase<R>
com.flexganttfx.view.GanttChartLite<R>
- Typparameter:
R- the type of the rows shown by the Gantt chart (e.g. "Aircraft")
- Alle implementierten Schnittstellen:
Styleable, EventTarget, Skinnable
A control used to visualize any kind of scheduling data along a
timeline. The model data needed by the control consists of rows with
activities, links between activities, and layers to group activities
together.
The control consists of several children controls: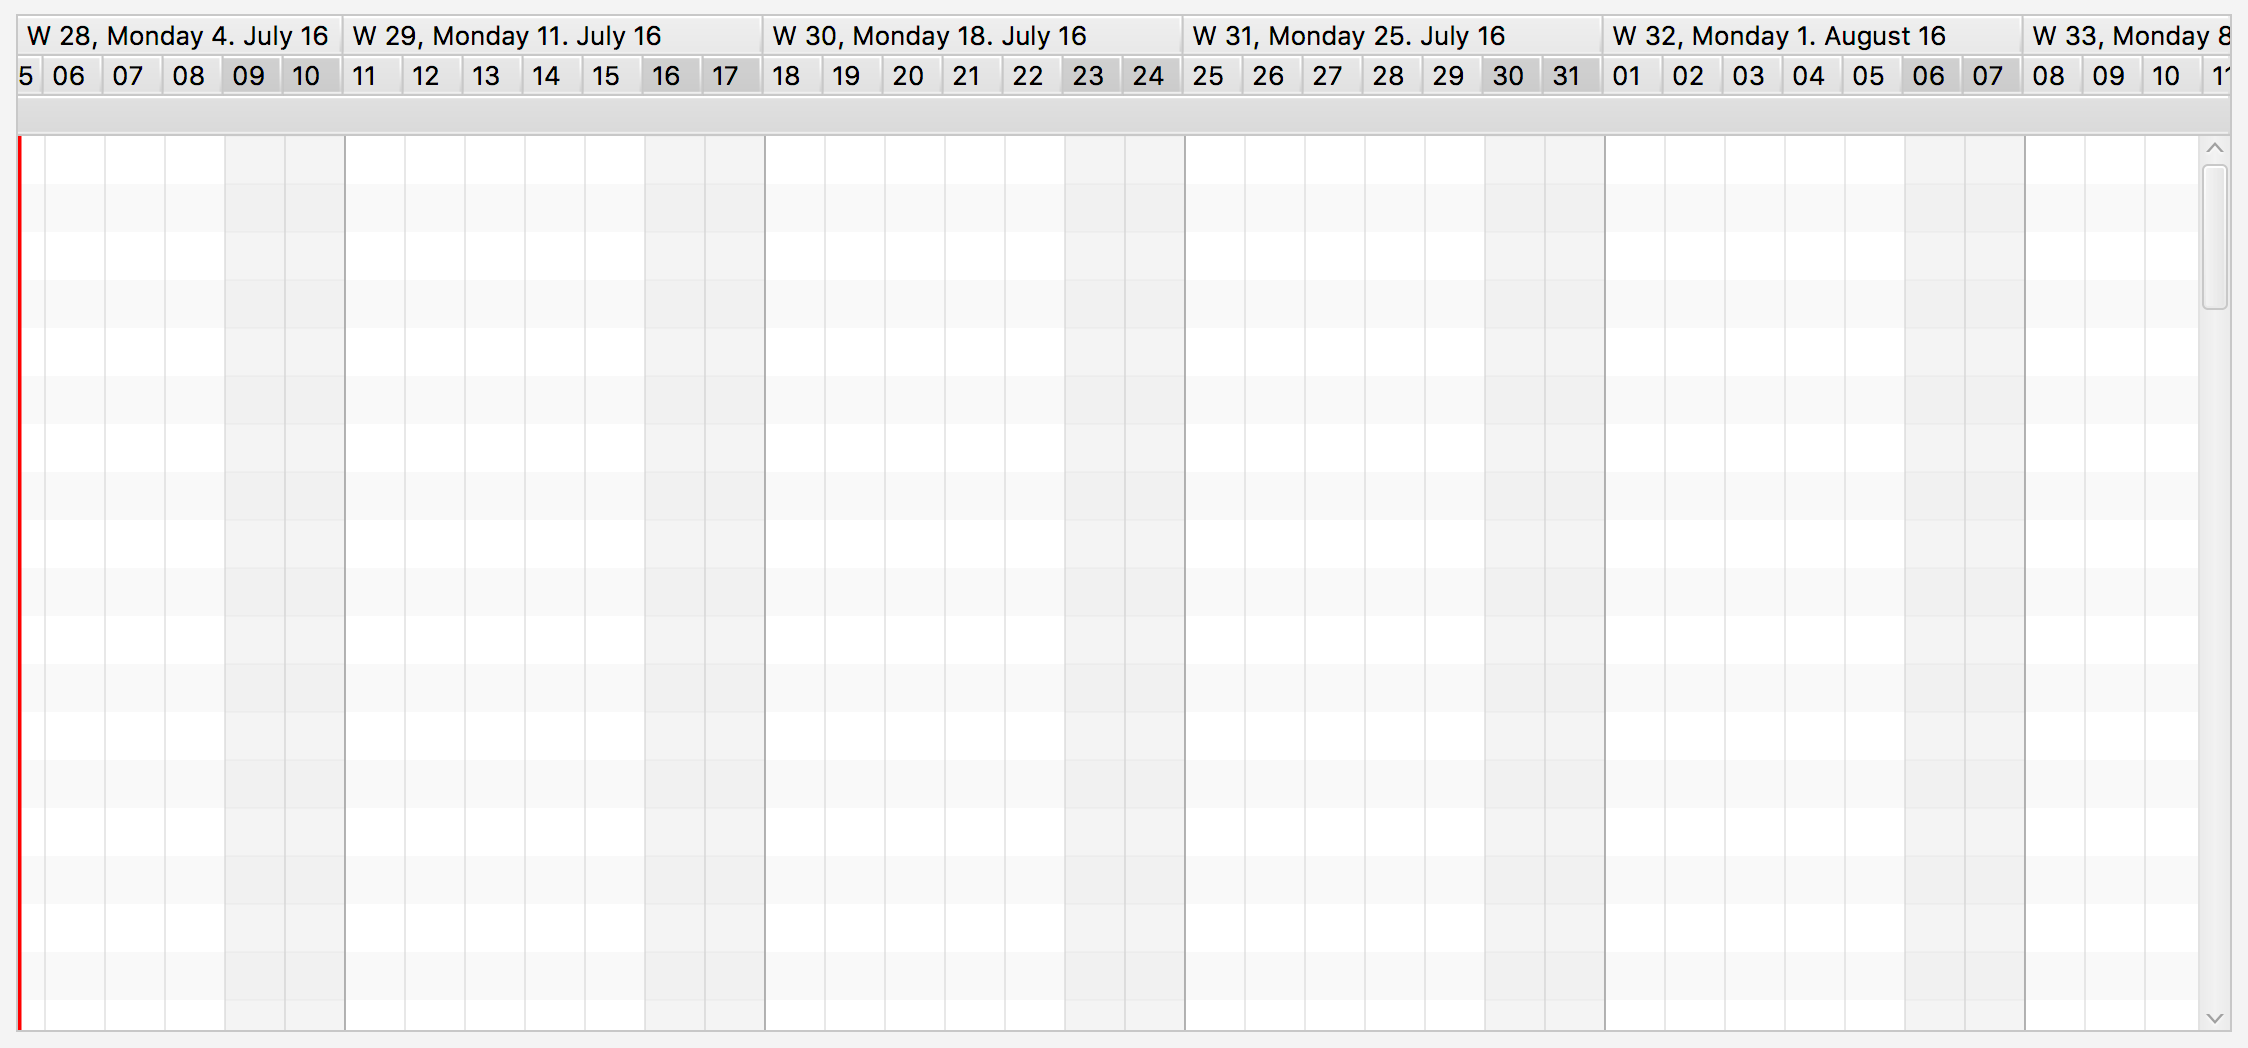
getRows()- returns the list of rowsGanttChartBase.getLayers()- returns the list of layersGanttChartBase.getLinks()- returns the list of links between activities
The control consists of several children controls:
GraphicsBase: shown on the right-hand side to display a graphical representation of the model dataTimeline: shown above the graphics view. The timeline itself consists of two child controls.Dateline: displays days, weeks, months, years, etc...Eventline: displays various time markers
Visually the lite Gantt chart is very similar to a regular Gantt chart that is using the display mode GRAPHICS_ONLY. The big difference is that the lite Gantt chart does not create a tree table view and that the rows can be added as a simple list instead of a hierarchy of rows.
The screenshot belows shows the initial appearance of an empty Gantt chart (lite) control.
Master / Detail Panes
The Gantt chart uses a single MasterDetailPane instance from ControlsFX for the high-level layout. The pane initially displays a property sheet as its detail node. The property sheet is used at development time and can be replaced with any node by callingGanttChartBase.setDetail(Node). The property
sheet displays a lot of properties that are used by the controls, the
renderers, the system layers to fine-tune the appearance of the control. Many
of them can be changed at runtime.
Standalone vs. Multi- / Dual Gantt Chart
A Gantt chart can be used standalone or inside aMultiGanttChartLiteContainer or
DualGanttChartLiteContainer. When used in one of these containers the
Position of the Gantt chart becomes important. The control can be the
first chart, the last chart, the only chart, or a chart somewhere in the
middle. A "first" or "only" chart always displays a timeline. A "middle" or
"last" displays an (optional) special header (see GanttChartBase.setGraphicsHeader(Node)). The
containers are also the reason why the control distinguishes between a
timeline (GanttChartBase.getTimeline()) and a master timeline (
GanttChartBase.getMasterTimeline()). The master timeline is the one shown by the
"first" chart, while the regular timeline is the one that belongs directly to
an individual Gantt chart instance.
Code Example
import java.time.Duration;
import java.time.Instant;
import java.time.temporal.ChronoUnit;

import javafx.application.Application;
import javafx.scene.Scene;
import javafx.stage.Stage;

import com.flexganttfx.model.GanttChartModel;
import com.flexganttfx.model.Layer;
import com.flexganttfx.model.Row;
import com.flexganttfx.model.activity.MutableActivityBase;
import com.flexganttfx.model.layout.GanttLayout;
import com.flexganttfx.view.GanttChart;
import com.flexganttfx.view.graphics.GraphicsView;
import com.flexganttfx.view.graphics.renderer.ActivityBarRenderer;
import com.flexganttfx.view.timeline.Timeline;

public class TutorialAircraftFlight extends Application {


 class FlightData {
        String flightNo;
        Instant departureTime = Instant.now();
        Instant arrivalTime = Instant.now().plus(Duration.ofHours(6));

        public FlightData(String flightNo, int day) {
                this.flightNo = flightNo;
                departureTime = departureTime.plus(Duration.ofDays(day));
                arrivalTime = arrivalTime.plus(Duration.ofDays(day));
   }
 }

 class Flight extends MutableActivityBase<FlightData> {
        public Flight(FlightData data) {
                setUserObject(data);
                setName(data.flightNo);
                setStartTime(data.departureTime);
                setEndTime(data.arrivalTime);
   }
 }

 class Aircraft extends Row<Aircraft, Aircraft, Flight> {
        public Aircraft(String name) {
                super(name);
   }
 }

 public void start(Stage stage) {
        // Create the Gantt chart
        GanttChartLite<Aircraft> gantt = new GanttChartLite<>(new FlightSchedule(new Aircraft("ROOT")));

        Layer flightsLayer = new Layer("Flights");
        gantt.getLayers().add(flightsLayer);

        Aircraft b747 = new Aircraft("B747");
        b747.addActivity(flightsLayer, new Flight(new FlightData("flight1", 1)));
        b747.addActivity(flightsLayer, new Flight(new FlightData("flight2", 2)));
        b747.addActivity(flightsLayer, new Flight(new FlightData("flight3", 3)));

        Aircraft a380 = new Aircraft("A380");
        a380.addActivity(flightsLayer, new Flight(new FlightData("flight1", 1)));
        a380.addActivity(flightsLayer, new Flight(new FlightData("flight2", 2)));
        a380.addActivity(flightsLayer, new Flight(new FlightData("flight3", 3)));

        gantt.getRows().setAll(b747, a380);

        Timeline timeline = gantt.getTimeline();
        timeline.showTemporalUnit(ChronoUnit.HOURS, 10);

        GraphicsView<Aircraft> graphics = gantt.getGraphics();
        graphics.setActivityRenderer(Flight.class, GanttLayout.class,
                        new ActivityBarRenderer<>(graphics, "Flight Renderer"));
        graphics.showEarliestActivities();

        Scene scene = new Scene(gantt);
        stage.setScene(scene);
        stage.sizeToScene();
        stage.centerOnScreen();
        stage.show();
 }

 public static void main(String[] args) {
        launch(args);
 }
- Seit:
- 1.6
-
Verschachtelte Klassen - Übersicht
Von Klasse geerbte verschachtelte Klassen/Schnittstellen GanttChartBase
GanttChartBase.ScrollBarType -
Eigenschaftsübersicht
EigenschaftenTypEigenschaftBeschreibungfinal ListProperty<R> Returns the property used to store the list of rows.Von Klasse geerbte Eigenschaften GanttChartBase
autoHideScrollBar, detail, fixedCellSize, graphicsHeader, masterTimeline, position, rowFilter, scrollBarType, showDetailVon Klasse geerbte Eigenschaften Control
contextMenu, skin, tooltipVon Klasse geerbte Eigenschaften Region
background, border, cacheShape, centerShape, height, insets, maxHeight, maxWidth, minHeight, minWidth, opaqueInsets, padding, prefHeight, prefWidth, scaleShape, shape, snapToPixel, widthVon Klasse geerbte Eigenschaften Parent
needsLayoutVon Klasse geerbte Eigenschaften Node
accessibleHelp, accessibleRoleDescription, accessibleRole, accessibleText, blendMode, boundsInLocal, boundsInParent, cacheHint, cache, clip, cursor, depthTest, disabled, disable, effectiveNodeOrientation, effect, eventDispatcher, focused, focusTraversable, hover, id, inputMethodRequests, layoutBounds, layoutX, layoutY, localToParentTransform, localToSceneTransform, managed, mouseTransparent, nodeOrientation, onContextMenuRequested, onDragDetected, onDragDone, onDragDropped, onDragEntered, onDragExited, onDragOver, onInputMethodTextChanged, onKeyPressed, onKeyReleased, onKeyTyped, onMouseClicked, onMouseDragEntered, onMouseDragExited, onMouseDragged, onMouseDragOver, onMouseDragReleased, onMouseEntered, onMouseExited, onMouseMoved, onMousePressed, onMouseReleased, onRotate, onRotationFinished, onRotationStarted, onScrollFinished, onScroll, onScrollStarted, onSwipeDown, onSwipeLeft, onSwipeRight, onSwipeUp, onTouchMoved, onTouchPressed, onTouchReleased, onTouchStationary, onZoomFinished, onZoom, onZoomStarted, opacity, parent, pickOnBounds, pressed, rotate, rotationAxis, scaleX, scaleY, scaleZ, scene, style, translateX, translateY, translateZ, viewOrder, visible -
Feldübersicht
Von Klasse geerbte Felder Region
USE_COMPUTED_SIZE, USE_PREF_SIZEVon Klasse geerbte Felder Node
BASELINE_OFFSET_SAME_AS_HEIGHT -
Konstruktorübersicht
Konstruktoren -
Methodenübersicht
Modifikator und TypMethodeBeschreibungprotected Skin<?> Creates the default skin for this lite Gantt chart.final ObservableList<R> getRows()Returns the list that is used to store all rows of the model.final ListProperty<R> Returns the property used to store the list of rows.final voidsetRows(ObservableList<R> rows) Sets the value of therowsProperty().Von Klasse geerbte Methoden GanttChartBase
autoHideScrollBarProperty, createGraphics, createHorizonScrollBar, createTimeline, createTimelineScrollBar, detailProperty, fixedCellSizeProperty, getCalendars, getDetail, getFixedCellSize, getGraphics, getGraphicsHeader, getGraphicsMasterDetailPane, getHorizonScrollBar, getLayers, getLinks, getMasterTimeline, getPosition, getRowFilter, getScrollBarType, getTimeline, getTimelineScrollBar, getUserAgentStylesheet, graphicsHeaderProperty, isAutoHideScrollBar, isShowDetail, masterTimelineProperty, positionProperty, redrawObservable, rowFilterProperty, scrollBarTypeProperty, setAutoHideScrollBar, setDetail, setFixedCellSize, setGraphicsHeader, setMasterTimeline, setPosition, setRowFilter, setScrollBarType, setShowDetail, showDetailPropertyVon Klasse geerbte Methoden FlexGanttFXControl
getUserAgentStylesheetVon Klasse geerbte Methoden Control
computeMaxHeight, computeMaxWidth, computeMinHeight, computeMinWidth, computePrefHeight, computePrefWidth, contextMenuProperty, executeAccessibleAction, getBaselineOffset, getClassCssMetaData, getContextMenu, getControlCssMetaData, getCssMetaData, getInitialFocusTraversable, getSkin, getTooltip, isResizable, layoutChildren, queryAccessibleAttribute, setContextMenu, setSkin, setTooltip, skinProperty, tooltipPropertyVon Klasse geerbte Methoden Region
backgroundProperty, borderProperty, cacheShapeProperty, centerShapeProperty, getBackground, getBorder, getHeight, getInsets, getMaxHeight, getMaxWidth, getMinHeight, getMinWidth, getOpaqueInsets, getPadding, getPrefHeight, getPrefWidth, getShape, getWidth, heightProperty, insetsProperty, isCacheShape, isCenterShape, isScaleShape, isSnapToPixel, layoutInArea, layoutInArea, layoutInArea, layoutInArea, maxHeight, maxHeightProperty, maxWidth, maxWidthProperty, minHeight, minHeightProperty, minWidth, minWidthProperty, opaqueInsetsProperty, paddingProperty, positionInArea, positionInArea, prefHeight, prefHeightProperty, prefWidth, prefWidthProperty, resize, scaleShapeProperty, setBackground, setBorder, setCacheShape, setCenterShape, setHeight, setMaxHeight, setMaxSize, setMaxWidth, setMinHeight, setMinSize, setMinWidth, setOpaqueInsets, setPadding, setPrefHeight, setPrefSize, setPrefWidth, setScaleShape, setShape, setSnapToPixel, setWidth, shapeProperty, snappedBottomInset, snappedLeftInset, snappedRightInset, snappedTopInset, snapPosition, snapPositionX, snapPositionY, snapSize, snapSizeX, snapSizeY, snapSpace, snapSpaceX, snapSpaceY, snapToPixelProperty, widthPropertyVon Klasse geerbte Methoden Parent
getChildren, getChildrenUnmodifiable, getManagedChildren, getStylesheets, isNeedsLayout, layout, lookup, needsLayoutProperty, requestLayout, requestParentLayout, setNeedsLayout, updateBoundsVon Klasse geerbte Methoden Node
accessibleHelpProperty, accessibleRoleDescriptionProperty, accessibleRoleProperty, accessibleTextProperty, addEventFilter, addEventHandler, applyCss, autosize, blendModeProperty, boundsInLocalProperty, boundsInParentProperty, buildEventDispatchChain, cacheHintProperty, cacheProperty, clipProperty, computeAreaInScreen, contains, contains, cursorProperty, depthTestProperty, disabledProperty, disableProperty, effectiveNodeOrientationProperty, effectProperty, eventDispatcherProperty, fireEvent, focusedProperty, focusTraversableProperty, getAccessibleHelp, getAccessibleRole, getAccessibleRoleDescription, getAccessibleText, getBlendMode, getBoundsInLocal, getBoundsInParent, getCacheHint, getClip, getContentBias, getCursor, getDepthTest, getEffect, getEffectiveNodeOrientation, getEventDispatcher, getId, getInitialCursor, getInputMethodRequests, getLayoutBounds, getLayoutX, getLayoutY, getLocalToParentTransform, getLocalToSceneTransform, getNodeOrientation, getOnContextMenuRequested, getOnDragDetected, getOnDragDone, getOnDragDropped, getOnDragEntered, getOnDragExited, getOnDragOver, getOnInputMethodTextChanged, getOnKeyPressed, getOnKeyReleased, getOnKeyTyped, getOnMouseClicked, getOnMouseDragEntered, getOnMouseDragExited, getOnMouseDragged, getOnMouseDragOver, getOnMouseDragReleased, getOnMouseEntered, getOnMouseExited, getOnMouseMoved, getOnMousePressed, getOnMouseReleased, getOnRotate, getOnRotationFinished, getOnRotationStarted, getOnScroll, getOnScrollFinished, getOnScrollStarted, getOnSwipeDown, getOnSwipeLeft, getOnSwipeRight, getOnSwipeUp, getOnTouchMoved, getOnTouchPressed, getOnTouchReleased, getOnTouchStationary, getOnZoom, getOnZoomFinished, getOnZoomStarted, getOpacity, getParent, getProperties, getPseudoClassStates, getRotate, getRotationAxis, getScaleX, getScaleY, getScaleZ, getScene, getStyle, getStyleableParent, getStyleClass, getTransforms, getTranslateX, getTranslateY, getTranslateZ, getTypeSelector, getUserData, getViewOrder, hasProperties, hoverProperty, idProperty, inputMethodRequestsProperty, intersects, intersects, isCache, isDisable, isDisabled, isFocused, isFocusTraversable, isHover, isManaged, isMouseTransparent, isPickOnBounds, isPressed, isVisible, layoutBoundsProperty, layoutXProperty, layoutYProperty, localToParent, localToParent, localToParent, localToParent, localToParent, localToParentTransformProperty, localToScene, localToScene, localToScene, localToScene, localToScene, localToScene, localToScene, localToScene, localToScene, localToScene, localToSceneTransformProperty, localToScreen, localToScreen, localToScreen, localToScreen, localToScreen, lookupAll, managedProperty, mouseTransparentProperty, nodeOrientationProperty, notifyAccessibleAttributeChanged, onContextMenuRequestedProperty, onDragDetectedProperty, onDragDoneProperty, onDragDroppedProperty, onDragEnteredProperty, onDragExitedProperty, onDragOverProperty, onInputMethodTextChangedProperty, onKeyPressedProperty, onKeyReleasedProperty, onKeyTypedProperty, onMouseClickedProperty, onMouseDragEnteredProperty, onMouseDragExitedProperty, onMouseDraggedProperty, onMouseDragOverProperty, onMouseDragReleasedProperty, onMouseEnteredProperty, onMouseExitedProperty, onMouseMovedProperty, onMousePressedProperty, onMouseReleasedProperty, onRotateProperty, onRotationFinishedProperty, onRotationStartedProperty, onScrollFinishedProperty, onScrollProperty, onScrollStartedProperty, onSwipeDownProperty, onSwipeLeftProperty, onSwipeRightProperty, onSwipeUpProperty, onTouchMovedProperty, onTouchPressedProperty, onTouchReleasedProperty, onTouchStationaryProperty, onZoomFinishedProperty, onZoomProperty, onZoomStartedProperty, opacityProperty, parentProperty, parentToLocal, parentToLocal, parentToLocal, parentToLocal, parentToLocal, pickOnBoundsProperty, pressedProperty, pseudoClassStateChanged, relocate, removeEventFilter, removeEventHandler, requestFocus, resizeRelocate, rotateProperty, rotationAxisProperty, scaleXProperty, scaleYProperty, scaleZProperty, sceneProperty, sceneToLocal, sceneToLocal, sceneToLocal, sceneToLocal, sceneToLocal, sceneToLocal, sceneToLocal, sceneToLocal, screenToLocal, screenToLocal, screenToLocal, setAccessibleHelp, setAccessibleRole, setAccessibleRoleDescription, setAccessibleText, setBlendMode, setCache, setCacheHint, setClip, setCursor, setDepthTest, setDisable, setDisabled, setEffect, setEventDispatcher, setEventHandler, setFocused, setFocusTraversable, setHover, setId, setInputMethodRequests, setLayoutX, setLayoutY, setManaged, setMouseTransparent, setNodeOrientation, setOnContextMenuRequested, setOnDragDetected, setOnDragDone, setOnDragDropped, setOnDragEntered, setOnDragExited, setOnDragOver, setOnInputMethodTextChanged, setOnKeyPressed, setOnKeyReleased, setOnKeyTyped, setOnMouseClicked, setOnMouseDragEntered, setOnMouseDragExited, setOnMouseDragged, setOnMouseDragOver, setOnMouseDragReleased, setOnMouseEntered, setOnMouseExited, setOnMouseMoved, setOnMousePressed, setOnMouseReleased, setOnRotate, setOnRotationFinished, setOnRotationStarted, setOnScroll, setOnScrollFinished, setOnScrollStarted, setOnSwipeDown, setOnSwipeLeft, setOnSwipeRight, setOnSwipeUp, setOnTouchMoved, setOnTouchPressed, setOnTouchReleased, setOnTouchStationary, setOnZoom, setOnZoomFinished, setOnZoomStarted, setOpacity, setPickOnBounds, setPressed, setRotate, setRotationAxis, setScaleX, setScaleY, setScaleZ, setStyle, setTranslateX, setTranslateY, setTranslateZ, setUserData, setViewOrder, setVisible, snapshot, snapshot, startDragAndDrop, startFullDrag, styleProperty, toBack, toFront, toString, translateXProperty, translateYProperty, translateZProperty, usesMirroring, viewOrderProperty, visiblePropertyVon Klasse geerbte Methoden Object
clone, equals, finalize, getClass, hashCode, notify, notifyAll, wait, wait, waitVon Schnittstelle geerbte Methoden Styleable
getStyleableNode
-
Eigenschaftsdetails
-
rows
Returns the property used to store the list of rows.- Seit:
- 1.6
- Siehe auch:
-
-
Konstruktordetails
-
GanttChartLite
public GanttChartLite()Constructs a new Gantt Chart control.- Seit:
- 1.6
-
-
Methodendetails
-
createDefaultSkin
Creates the default skin for this lite Gantt chart.- Setzt außer Kraft:
createDefaultSkinin KlasseControl- Gibt zurück:
- the default skin
-
rowsProperty
Returns the property used to store the list of rows.- Gibt zurück:
- the list of rows
- Seit:
- 1.6
- Siehe auch:
-
setRows
Sets the value of therowsProperty().- Parameter:
rows- the new rows to display- Seit:
- 1.6
-
getRows
Returns the list that is used to store all rows of the model.- Gibt zurück:
- a list of rows
- Seit:
- 1.6
-